NYRaMP-Informatics-2024: Difference between revisions
| Line 34: | Line 34: | ||
* Pre-test: visualization, interpretation, and stats | * Pre-test: visualization, interpretation, and stats | ||
* Computer setup & software download/installation | * Computer setup & software download/installation | ||
* R Tutorial 1. Basics: interface, packages, variables, objects, functions | * R Tutorial 1. Getting started: Basics: interface, packages, variables, objects, functions | ||
==Week 2. Aug 13== | ==Week 2. Aug 13== | ||
Revision as of 02:39, 5 August 2024
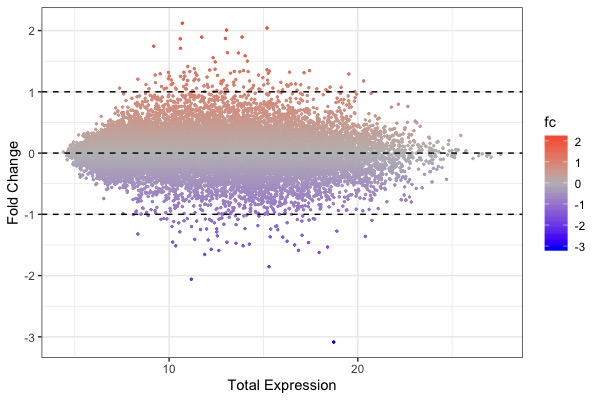
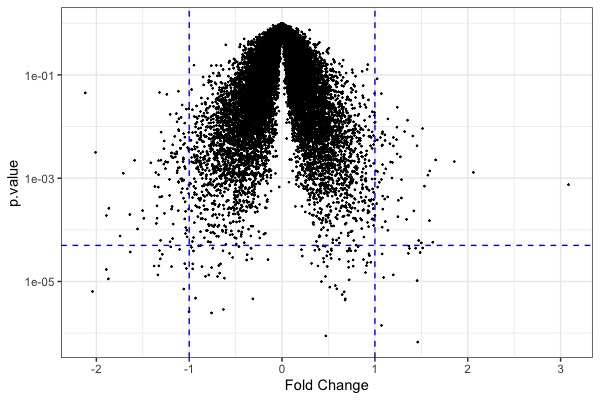
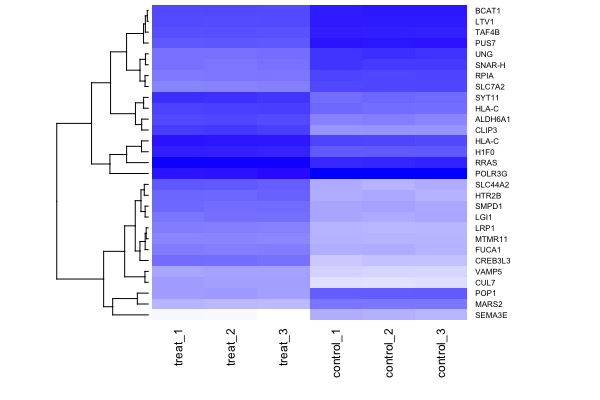
| MA plot | Volcano plot | Heat map |
|---|---|---|
Overview
A genome is the total genetic content of an organism. Driven by breakthroughs such as the decoding of the first human genome and rapid DNA and RNA-sequencing technologies, biomedical sciences are undergoing a rapid & irreversible transformation into a highly data-intensive field, that requires familiarity with concepts in both biological, computational, and statistical sciences.
Genome information is revolutionizing virtually all aspects of life sciences including basic research, medicine, and agriculture. Meanwhile, use of genomic data requires life scientists to be familiar with concepts and skills in biology, computer science, as well as statistics.
This workshop is designed to introduce computational analysis of genomic data through hands-on computational exercises.
Learning goals
By the end of this workshop students will be able to:
- Visualize genomics data using R & RStudio
- Perform t-tests, regression analysis, and association tests with R & Rstudio
- Interpret results of data visualization & statistical analysis
Web Links
- Install R Base & R Studio (Desktop version): https://posit.co/download/rstudio-desktop/
- Textbook: Introduction to R for Biologists
- Download: R datasets
- A reference book: R for Data Science (Wickharm & Grolemund)
Week 1. Aug 6
- Pre-test: visualization, interpretation, and stats
- Computer setup & software download/installation
- R Tutorial 1. Getting started: Basics: interface, packages, variables, objects, functions
Week 2. Aug 13
- R Tutorial 2. Data manipulation & visualization
Week 3. Aug 20
- R Tutorial 3. t-tests & linear regression
- Documentation & presentation with R Markdown
Week 4. Aug 27
- R Tutorial 4. Cluster analysis
- Exit self-test


