BioMed-R-2021
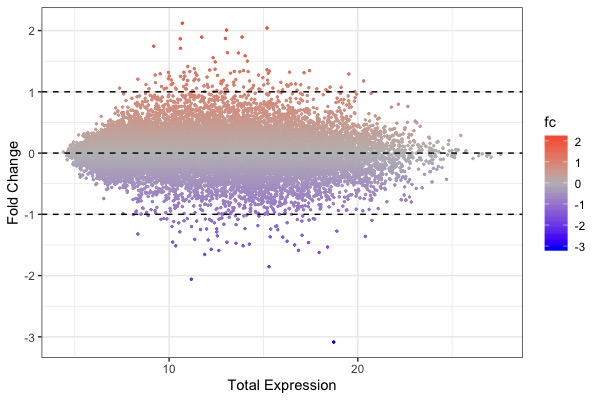
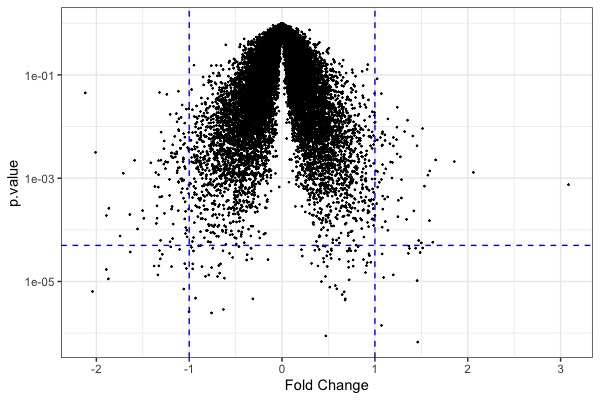
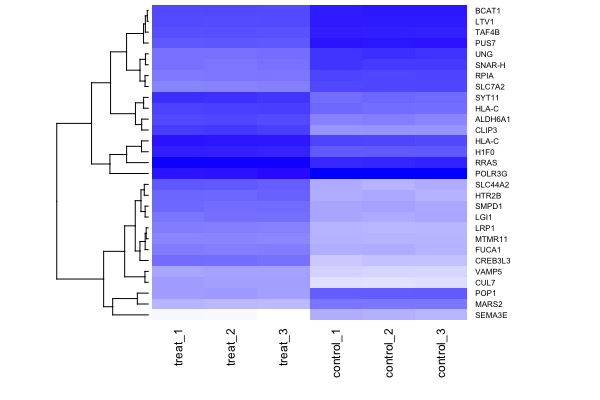
| MA plot | Volcano plot | Heat map |
|---|---|---|
Course Overview
Welcome to Introductory BioMedical Genomics, a seminar course for advanced undergraduates and graduate students. A genome is the total genetic content of an organism. Driven by breakthroughs such as the decoding of the first human genome and rapid DNA and RNA-sequencing technologies, biomedical sciences are undergoing a rapid & irreversible transformation into a highly data-intensive field, that requires familiarity with concepts in both biology, computational, and data sciences.
Genome information is revolutionizing virtually all aspects of life sciences including basic research, medicine, and agriculture. Meanwhile, use of genomic data requires life scientists to be familiar with concepts and skills in biology, computer science, as well as statistics.
This workshop is designed to introduce computational analysis of genomic data through hands-on computational exercises. Students are expected to be able to replicate key results of data analysis from published studies.
The pre-requisites of the course are college-level courses in molecular biology, cell biology, and genetics. Introductory courses in computer programming and statistics are preferred but not strictly required.
Learning goals
By the end of this course successful students will be able to:
- Describe next-generation sequencing (NGS) technologies & contrast it with traditional Sanger sequencing
- Explain applications of NGS technology including pathogen genomics, cancer genomics, human genomic variation, transcriptomics, meta-genomics, epi-genomics, and microbiome.
- Visualize and explore genomics data using R & RStudio
- Replicate key results using a raw data set produced by a primary research paper
Web Links
- Install R base: https://cloud.r-project.org
- Install R Studio (Desktop version): http://www.rstudio.com/download
- Textbook: Introduction to R for Biologists
- Download: R datasets
- A reference book: R for Data Science (Wickharm & Grolemund)
Quizzes and Exams
Student performance will be evaluated by attendance, weekly assignments, quizzes, and a final report in R Markdown:
- Attendance & In-class participation: 100 pts
- Assignments: 5 x 10 = 50 pts
- Quizzes: 2 x 25 pts = 50 pts
- Mid-term: 50 pts
- Final presentation & report: 50 pts
Total: 300 pts
Tips for Success
To maximize the your experience we strongly recommend the following strategies:
- Follow the directions for efficiently, finding high-impact papers, reading science research papers and preparing presentations.
- Read the papers, watch required videos and do the exercises regularly, long before you attend class.
- Attend all classes, as required. Late arrival results in loss of points.
- Keep up with online exercises. Don’t wait until the due date to start tasks.
- Take notes or annotate slides while attending the lectures.
- Listen actively and participate in class and in online discussions.
- Review and summarize material within 24 hrs after class.
- Observe the deadlines for submitting your work. Late submissions incur penalties.
- Put away cell phones, do not TM, email or play computer games in class.
Hunter/CUNY Policies
- Policy on Academic Integrity
Hunter College regards acts of academic dishonesty (e.g., plagiarism, cheating on homework, online exercises or examinations, obtaining unfair advantage, and falsification of records and official documents) as serious offenses against the values of intellectual honesty. The College is committed to enforcing the CUNY Policy on Academic Integrity, and we will pursue cases of academic dishonesty according to the Hunter College Academic Integrity Procedures. Students will be asked to read this statement before exams.
- ADA Policy
In compliance with the American Disability Act of 1990 (ADA) and with Section 504 of the Rehabilitation Act of 1973, Hunter College is committed to ensuring educational parity and accommodations for all students with documented disabilities and/or medical conditions. It is recommended that all students with documented disabilities (Emotional, Medical, Physical, and/or Learning) consult the Office of AccessABILITY, located in Room E1214B, to secure necessary academic accommodations. For further information and assistance, please call: (212) 772- 4857 or (212) 650-3230.
- Syllabus Policy
Except for changes that substantially affect implementation of the evaluation (grading) statement, this syllabus is a guide for the course and is subject to change with advance notice, announced in class or posted on Blackboard.
Course Schedule
Jan 30, 2021
- Introduction
- R Tutorial 1: Use interface, basic operations, load data. (slides available on Blackboard)
| In-class Exercise & Assignment 1 (15 pts) |
|---|
PropertyName,Density_250m,Density_500m,Density_1000m
HighbridgePark,0.006561319,0.009462031,0.010578611
BronxRiverParkway,0.001318749,0.001978858,0.002652118
CrotonaPark,0.009412087,0.01164712,0.01202321
ClaremontPark,0.016391948,0.019972485,0.020350481
VanCortlandtPark,0.000550151,0.000979312,0.001372675
|
Feb 6, 2021
- Introduction to NGS: (slides available on Blackboard)
- 1-slide presentations on Next-Generation Sequencing Technologies (Group I)
- R Tutorial, Part 2. Data manipulation with dplyr. Slides:
| In-class Exercise 2 (10 pts; Due in class) |
|---|
|
- Assignment 1 Due next day
Feb 13, 2021
- NGS presentations (Group II)
- R Tutorial. Part 3. Data visualization with ggplot2. Slides:
- No assignment (go over slides and 3 tutorial scripts to prepare for Quiz next week)
Feb 20, 2020
- Quiz 1 (Open Book)
- R Tutorial: Part 4. BioStat (chi-square & t-test) Lecture slides:
| Assignment 3 (10 pts). In-class workshop. Evaluation of papers according to the following rubrics (submit by email) |
|---|
|
Feb 27, 2020
- Paper evaluation & selection
- R Tutorial: Part 4. BioStat (regression & ANOVA)
March 6, 2020
- Self Study 1 (no class): RNA-Seq analysis. Assignment 4 (10 pts; due 3/14/2020): Self Study 1
- Review for mid-term exam: 6 PDF presentations (intro to NGS & 5 R-tutorials)
March 13, 2020
- Mid-term exam (50 pts). Open Book
March 20, 2020
- Live Session using Blackboard Collaborator
- Covid-19 Genome Tracker (developed by the Qiu Lab)
- Analysis of a Covid-19 symptom onset timing
- R Markdown Tutorial: R markdown template (by Hector)
- In-class Exercises
- Assignment 5 (10 pts; due next session): see above link
March 27, 2020
- No class: Spring Break
April 3, 2020
- In class workshop: Sef-study-3: Covid-19 cases
April 10, 2020
- Quiz II (25 pts; Open Book; R markdown-generated WORD/PDF file as submission)
- In-class workshop on identify genes/proteins/metabolites associated with tissue regeneration
- Article link (submission by Jenifer)
- Tutorial: Tutorial for case study
- Will be used for final presentation & R markdown report
April 17, 2020
- Reference & data sets for final project have been posted & assignments have been made: Final_project_assignment
- Before class: read paper, download assigned Excel workbook, save data set as TSV (tab-separated file); Read into R-studio.
- During class: present the data set, including:
- Biological question
- Experimental design: samples, sample sizes, controls
- Experimental techniques/measurements
- Data set description, column by column
- Visualization to be made
- Statistical tests to be performed
April 24, 2020
- Final_project_assignment
- Tutorial: Tutorial for case study (updated)
- Presentations of draft figures
May 1, 2020
- Self study (no live session)
- Tutorial: Tutorial for case study
- For final report, you are required to:
- Read the paper and identify a dataset to replicate
- Create an R markdown file to record your work
- Produce a final WORD or PDF file as final report
- Your final report (100 pts) should include the following required components:
- (10 pts) Section 1. Background & Objectives. Describe (a) the overall goal of the study; (b) the specific question to be addressed by your dataset
- (20 pts) Section 2. Material & Methods. Describe experimental design, i.e., how your assigned data set was generated, including the nature of the biological samples, sample size, number of replicates (biological & technical), controls (if any), sequencing technologies. Hint: Fig S1
- (40 pts) Section 3. R codes & graphs. Show R codes with comments for individual commands. Graphics should be as close to the published figure as possible (e.g., with proper axis labels)
- (10 pts) Section 4. Statistical analysis. Show mull hypothesis and p-value. Draw statistical conclusion
- (10 pts) Section 5. Conclusion. Draw biological conclusions of your analysis
- (10 pts) Section 6. Citations/source/URL to paper, your dataset, and methods
May 8, 2020
- Consultation (no mandatory participation)
May 15, 2020
- Consultation (no mandatory participation)
May 22, 2020
- Friday, 5pm: Final report Due (Blackboard submission)


