Qubi/biol202
Objectives
- Understand the microarray technology and its use in genomewide identification of gene functions.
- Be able to identify coexpressed and corepressed genes based on timecourse gene expression data.
Lab Report Grading Policy
- Introduction (3pt)
- Define transcriptome. Describe advantages of highthroughput technologies in comparison with traditional genebygene approaches of studying gene function. Your statements are not to be copied from the Lab Manual.
- Materials and Methods (4pts)
- Define “diauxic shift”. Summarize the design of the DNA chip. Describe experimental procedures of the DeRisi study that have produced these gene expression data.
- Results (12pts)
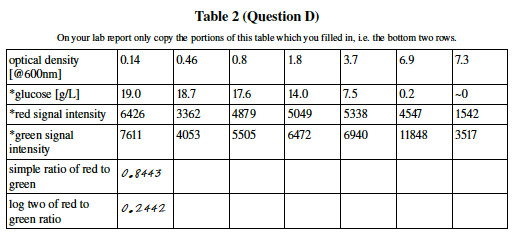
- Answers to twelve questions A L. Reproduce answers from your worksheets. For the questions that are TABLES, copy the table but you can omit some rows as indicated on some of the table captions.
- Discussion (9pts)
- Answer three discussion questions.
- Summary/Conclusion (1pt)
- A sentence or two will suffice.
- References (1pt)
- Credit is given for pertinent references obtained from sources other than the Lab Manual.
Introduction
Gene expression is the transcription of a DNA template into RNA molecules. In a multicellular organism, the subset of genes that are expressed defines and gives rise to a specific tissue or cell type. In a single-celled organism (such as Saccharomyces cerevisiae, the baker’s yeast), genes are turned on and off depending on environmental conditions. In this laboratory exercise, we will use bioinformatics techniques to identity genes that are expressed in the yeast during glucose starvation.
Traditionally, gene expressions are studied one gene at a time using blotting techniques. For example, in a Northern Blot experiment (Figure 4a), the whole messenger RNA (mRNA) content of a cell is extracted and loaded on a solid gel slab. Different mRNA molecules are then separated using electrophoresis and transferred to a nitrocellulose sheet. To identify if a gene is expressed, a radioactively (or fluorescently) labeled oligonucleotide probe that is specific to the gene sequence is applied to the sheet. If the gene is expressed, the probe will hybridize with a specific mRNA molecule and a black band will appear on an Xray film. Other blotting techniques for detecting gene expression include Southern Blot, in which mRNAs in a cell are reverse transcribed to their complementary DNA (cDNA) before being hybridized with gene-specific oligo-nucleotide probes. In a Western Blot experiment, the protein product (instead of the mRNA intermediate) of a gene is probed using antibodies (instead of the oligonucleotide probes).
After the genomic revolution since 1990s, it became possible to study the expression of all genes in a cell at once using high-throughput techniques. Detecting the expression profiles of a whole genome was made possible by the availability of the whole genome sequences of bacteria, yeasts, and humans. The DNA microarray is one such high throughput technique. In contrast to the Northern Blot technique in which the mRNA sample is fixed on a nylon sheet, nucleotide probes for all genes are fixed on a glass slide, creating a “gene chip”. The cellular mRNAs are reverse transcribed into cDNAs labeled with fluorescent dyes, which are then hybridized with the gene chips. After the unattached cDNAs are washed away, the fluorescent intensity remains at each probe location is measured as an indication of the amount of mRNA transcribed from each gene in a genome. The entire cellular RNA content transcribed from a genome is called a transcriptome. Each DNA microarray reading is therefore essentially a snap shot of the whole genome expression profile of a cell at a particular physiological stage. It is no longer necessary to know or decide beforehand candidate genes to be targets of exploration, as in the traditional blotting techniques.
Most recently, direct sequencing of the whole mRNA content of a cell using the so-called “next-generation” sequencing technologies provides an alternative and even more accurate way of obtaining the transcriptome of a cell. These high-throughput technologies, however, create new technical challenges of their own. The main challenge is the analysis of the huge amount of data resulting from each microarray or sequencing experiment. First, data from high-throughput experiments need computer-assisted data processing and analysis. Second, statistical analysis and testing become essential tools for the discovery and exploration of gene functions, e.g., finding co-expressed genes.
Procedures
1. Microarray Color Prediction
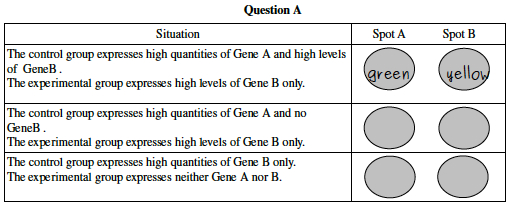
- Consider a microarray with only two spots, one for Gene A and one for Gene B. A researcher cultures two yeast strains in Glucose solution, extracts mRNA from the cells, creates cDNA with either red dye (for the experimental strain) or green dye (for the control strain). The dye containing cDNA is then allowed to combine with a microarray containing spots with complementary DNA for Gene A and Gene B. In each situation below, predict what color the two spots will show. The first answer is filled in for you as an example.
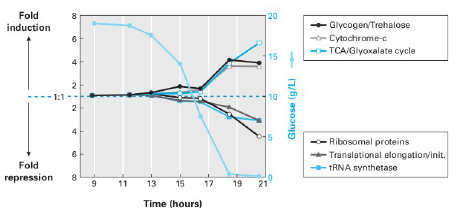
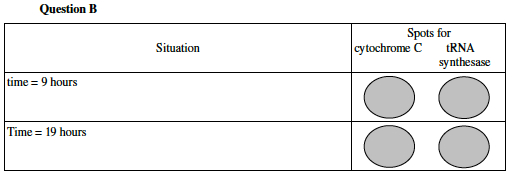
- Now consider a culture where one yeast population (the experimental group) is grown in a solution where the amount of glucose decreases over time to zero, while a second population (the control group) is grown in flask where the Glucose concentration remains nearly constant. The researcher then extracts mRNA from the yeast cells to creates red-dyed-DNA for the experimental strain and green dye for cDNA made from the control strain. The dye-containing cDNA is then allowed to combine with a microarray containing spots with complementary DNA for a cytochrome C gene and a tRNA synthesase Gene. The expression levels in the control group are assumed to remain constant for both genes but the expression levels for the experimental group change according to the graph in Figure 5. In each situation, predict what color the two spots will show.
2. Examining an Array Image
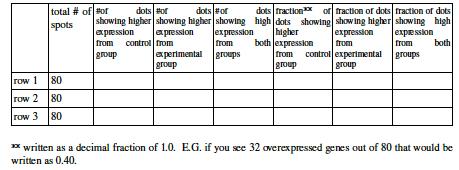
- For this question you will examine the top three rows from a microarray. Open a browser and access the image at http://cmgm.stanford.edu/pbrown/explore/M6.jpg. This is the magnified scan of an actual microarray from glucose deprived yeast. If you cannot access the image you may use an image provided by your lab instructor or Color Plate Figure 3.
- Your answers may differ slightly from your labmates, depending on your perception of color and quality of the image you are viewing. Table 1 is only meant to be an estimation, not an exact number.
3. Quantifying the Array Color Intensity
Question E: What can you tell about the yeast cell density by looking at the O.D. line of the chart? How was this measured?
Question F: What molecule must bind to the microarray in order to create a strong green signal? What makes the green glow? Which type of cells, the control or the experimental sample, is the green signal associated with and which type of cells is the red signal associated with?
- Quick review of logarithms:
- Base two logarithms are a measure of how much a thing has doubled. log2(1) = 0, log2(8) = 3, log2 of (.25) = 2 [note the negative sign]. If your calculator doesn't have a log2 function, you may use log10 and multiply your result by 3.3219.
Discussion Questions
????
References & Resources
????
