Spombe
Jump to navigation
Jump to search
Tuesday, October 30, 2013
Gene export affected by OE or DK of nup211: Dotplot of ratio of genes expression (C/N)
| Title | Plot | Excel file | |
|---|---|---|---|
| Strain 10 vs. 558 | |||
| Strain 13 vs. 558 |
Monday, October 29, 2013
Differentially expressed genes (fold_change >=2)
| Title | Plot | Excel file |
|---|---|---|
| MAPlot of 158 genes (s4 vs. s1) | (SVG graph: download & mouseover to view gene names) | |
| MAPlot of 158 genes (s4 vs. s1) | ||
| MAPlot of 240 genes (s7 vs. s1) |
Friday, October 25, 2013
Comparison of 3 Samples with total mRNA (We debugged rows with multiple gene IDs)
| Title | Plot | Plot (scaled by gene) | Excel file |
|---|---|---|---|
| Heatmap of 90 significant genes in 3 samples |
Wednesday, October 23, 2013
Comparison of 3 Samples with total mRNA
| Title | Plot | Plot (scaled by gene) | Excel file | |
|---|---|---|---|---|
| Heatmap of 89 significant genes in 3 samples |
Thursday, October 17, 2013
mRNA export affected by KD or OE of nup211
| Title | Plot |
|---|---|
| Export (C/N) of 40 genes affected by KD of nup211 (heatmap) | |
| Export (C/N) of 39 genes affected by OE of nup211 (heatmap) |
Wednesday, October 16, 2013
Comparison of 4 Samples with total mRNA
| Title | Plot | Plot (scaled by gene) |
|---|---|---|
| Heatmap of 76 significant genes |
Friday, October 11, 2013
Comparison of all 10 Samples
| Title | Plot | Plot (scaled by gene) |
|---|---|---|
| Barplot Nup 211 | ||
| Heatmap of 13 genes of interest | ||
| Heatmap of 80 significant genes | ||
| Heatmap of 39 genes of interest |
Tuesday, October 8, 2013
Comparison between Samples 1,4,7, and 10
| Title | Plots |
|---|---|
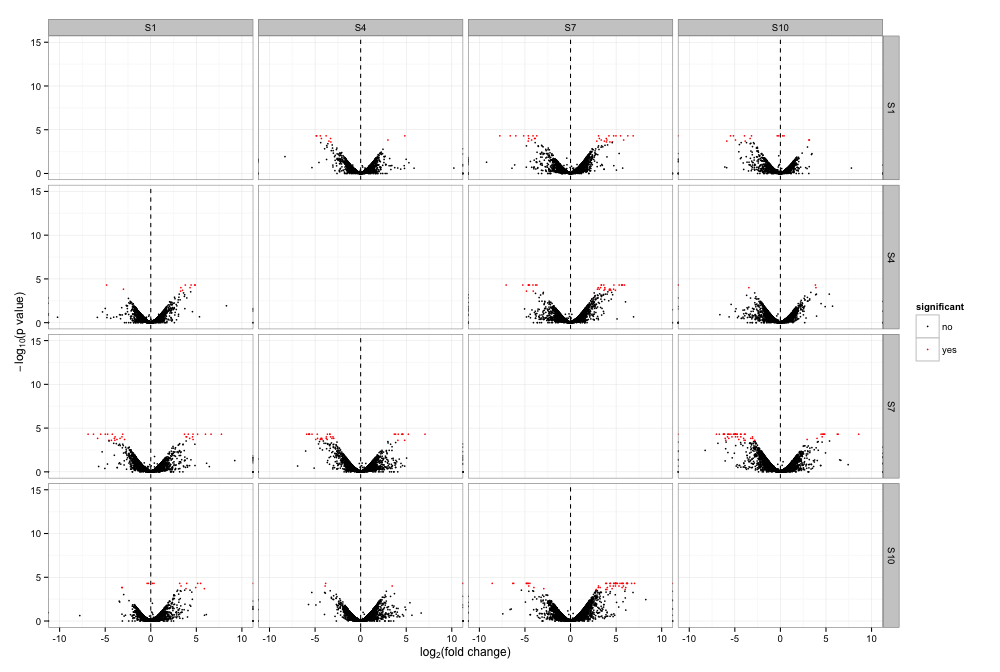
| Volcano Plots | |
| Heatmap of 13 genes of interest | |
| Heatmap of 76 significant genes |
References
- Trapnell et al (2012). Nature Protocol. 7(2): 562.
- Goff et al (2012). CummeRbund Manual
