Spombe
Jump to navigation
Jump to search
Saturday, November 2, 2013
Interactive MA Plots
| Title | Plot | |||||||||||||||||||||||||||||||||||||||||||||||||||||||||||||||||||||
|---|---|---|---|---|---|---|---|---|---|---|---|---|---|---|---|---|---|---|---|---|---|---|---|---|---|---|---|---|---|---|---|---|---|---|---|---|---|---|---|---|---|---|---|---|---|---|---|---|---|---|---|---|---|---|---|---|---|---|---|---|---|---|---|---|---|---|---|---|---|---|
| Strain s4 vs. s1 | ||||||||||||||||||||||||||||||||||||||||||||||||||||||||||||||||||||||
| Strain s7 vs. s1 |
Tuesday, October 30, 2013Gene export affected by OE or KD of nup211: Dotplot of C/N ratios of genes expression
Monday, October 29, 2013Differentially expressed genes (fold_change >=2)
Friday, October 25, 2013Comparison of 3 Samples with total mRNA (We debugged rows with multiple gene IDs)
Wednesday, October 23, 2013Comparison of 3 Samples with total mRNA
Thursday, October 17, 2013mRNA export affected by KD or OE of nup211
Wednesday, October 16, 2013Comparison of 4 Samples with total mRNA
Friday, October 11, 2013Comparison of all 10 Samples
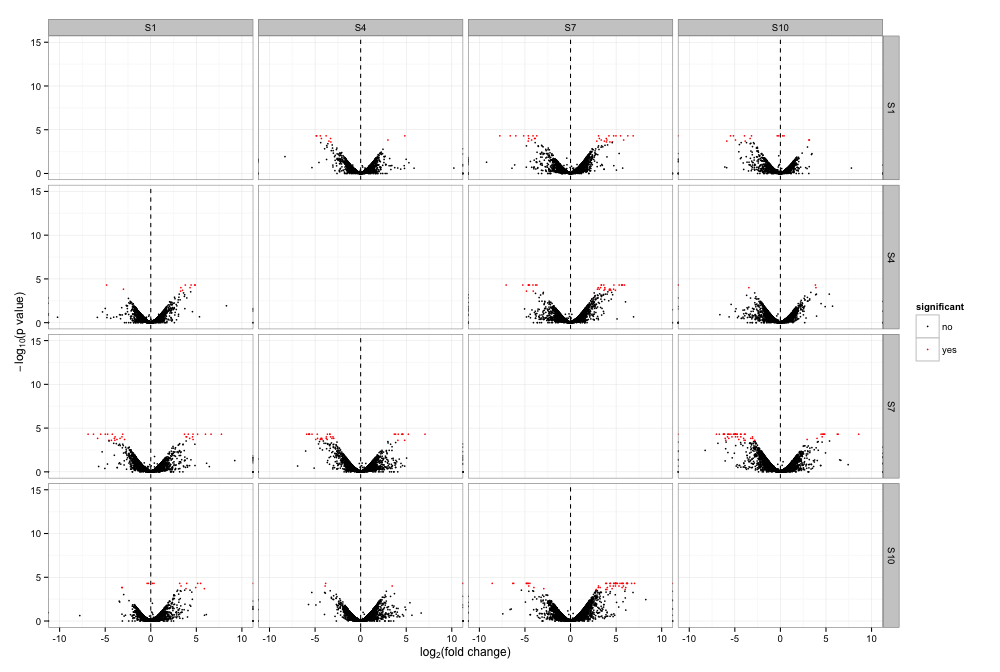
Tuesday, October 8, 2013Comparison between Samples 1,4,7, and 10
References
|
