Intro Genome Bio 2013: Difference between revisions
Jump to navigation
Jump to search
BIOL 105. Introduction to Genome Biology (Fall 2013)
Instructor: Dr Weigang Qiu, Associate Professor of Biology
Room: C104 Hunter North (a Computer Lab)
Hours: Tuesdays, 12:45-3:15PM
Office Hours: Room 839 HN; Tuesday 5-7pm or by appointment. Phone: 212-772-5296.
Email: weigang@genectr.hunter.cuny.edu (I will advise students before and after the class as well as during office hours. Emails will be answered only in special situations.)
Volunteer Tutors: Slav Kendall<sviatoslav.kendall at gmail.com> & Rayees Rahman<rayees.rahman at live.com>
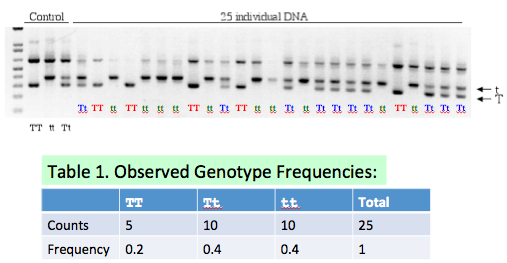
Table 1 Observed Counts:
Table 2. Expected Counts (if there is no association between the genotypes and the disease phenotype)
imported>Weigang |
imported>Weigang |
||
| Line 145: | Line 145: | ||
* Cancer Genomics: Field trip to [http://ccsbsymposium.mskcc.org/Agenda.aspx 3rd Annual Symposium of Systems Biology of Cancer at MSKCC]. We will attend the '''Afternoon Session B''', which has three talks during 1:30-3pm. Take notes and hand in one copy | * Cancer Genomics: Field trip to [http://ccsbsymposium.mskcc.org/Agenda.aspx 3rd Annual Symposium of Systems Biology of Cancer at MSKCC]. We will attend the '''Afternoon Session B''', which has three talks during 1:30-3pm. Take notes and hand in one copy | ||
* Assignment #7. (Finalized Wed, 10/30, 3pm) | * Assignment #7. (Finalized Wed, 10/30, 3pm) | ||
# (2 pts) Exercise 3.14 (pg. 111). Show your work.<pre style="white-space: pre-wrap;">see "Contig 2" in the following figure</pre> | # (2 pts) Exercise 3.14 (pg. 111). Show your work.<pre style="white-space: pre-wrap;">see "Contig 2" in the following figure</pre>[[File:Contig.jpg|thumbnail]] | ||
# (3 pts) Exercise 3.15 (pg. 111). Show your work. [Hint: Enlarge the picture (e.g., double the size), and then measure the lengths of individual fragments and the region with a ruler. Read the measurements in millimeters.] <pre style="white-space: pre-wrap;">(a) The minimum coverage of any position is zero (in the gap region, see figure | # (3 pts) Exercise 3.15 (pg. 111). Show your work. [Hint: Enlarge the picture (e.g., double the size), and then measure the lengths of individual fragments and the region with a ruler. Read the measurements in millimeters.] <pre style="white-space: pre-wrap;">(a) The minimum coverage of any position is zero (in the gap region, see figure at right), (b) the maximal coverage of any position is at the red vertical line (see figure at right), which is covered by 9 individual reads. (c) The average coverage of the entire region is the sum of lengths of all reads divided by the length of the region. The answer is approximately 4, indicating that on average each DNA position is covered by 4 sequencing reads. </pre> | ||
# (5 pts) Search the NCBI Gene database for "BRCA1" gene. Based on [http://www.ncbi.nlm.nih.gov/gene/672 this Gene Card for the human version of the gene], summarize its molecular function, chromosomal location, gene structure (number of exons and introns, lengths of primary transcript, mRNA, and protein), mutations associated with cancers. Follow the link to OMIM to find out what are the 185delAG and 5382insC mutations (base substitution, deletion, insertion, consequence to protein synthesis?) and in what exons do they appear. [Hint: See following youtube video for different types of mutations: {{#ev:youtube|kp0esidDr-c|300|center|Frameshift mutations}} | # (5 pts) Search the NCBI Gene database for "BRCA1" gene. Based on [http://www.ncbi.nlm.nih.gov/gene/672 this Gene Card for the human version of the gene], summarize its molecular function, chromosomal location, gene structure (number of exons and introns, lengths of primary transcript, mRNA, and protein), mutations associated with cancers. Follow the link to OMIM to find out what are the 185delAG and 5382insC mutations (base substitution, deletion, insertion, consequence to protein synthesis?) and in what exons do they appear. [Hint: See following youtube video for different types of mutations: {{#ev:youtube|kp0esidDr-c|300|center|Frameshift mutations}} | ||
Revision as of 22:58, 7 November 2013
General Information

Course Description
- Background: A genome is the total genetic content of an organism. Driven by breakthroughs such as the decoding of the first human genome and rapid DNA-sequencing technologies, biomedical sciences are undergoing a rapid and profound transformation into a highly data-intensive field, which requires familiarity with concepts in both biology and computer science. Genome information is revolutionizing virtually all aspects of biology and medicine and will lead to major advances such as more efficient production of renewable energy, better cures for cancers, and longer and healthier life expectancy.
- Contents: This course will introduce genome-sequencing technologies, explore genome projects online, and discuss both the benefits and challenges (e.g., ethical and legal) of the genomic revolution to society. Each session will consist of lecture instructions and computer-based laboratory practices.
- Learning Goals
- Human Genome: Knowing the basic content and structure of the human genome
- Central Dogma: Understanding the Central Dogma and how genes are regulated (i.e., turned on/off)
- Genome diversity: Knowing the three major divisions of life, the use of DNA/protein sequences to classify organisms, and mechanisms of genome evolution
- Bioinformatics: Understanding the importance of computation and statistics in producing, analyzing, and disseminating genome information
- Learning Outcomes
- Be able to describe the structure and function of the human genome
- Be able to find chromosomal location, function, disease-association, and variability of a human gene using scientific databases
- Be able to identify and classify organisms based on their DNA sequences
- Be able to describe the processes of genome evolution, including mutation, duplication, recombination, horizontal gene transfer, genetic drift, and natural selection
- Textbook: Arthur Lesk (2012). Introduction to Genomics (2nd Edition). Oxford University Press. Amazon Link
- Academic Honesty: Hunter College regards acts of academic dishonesty (e.g., plagiarism, cheating on examinations, obtaining unfair advantage, and falsification of records and official documents) as serious offenses against the values of intellectual honesty. The College is committed to enforcing the CUNY Policy on Academic Integrity and will pursue cases of academic dishonesty according to the Hunter College Academic Integrity Procedures.
Grading Policy
- Treat assignments as take-home exams. Student performance will be evaluated by weekly assignments and three exams. While students are allowed to work in groups for assignments (and answers to some questions are available on the textbook website), students are expected to compose the final answers independently. Writings that are virtually exact copies to each other or to the web answers will be considered plagiarism. Zero points will be given to ALL involved individuals if the instructor considers there is enough evidence for plagiarism. To avoid being investigated for plagiarism, Do NOT copy or let others copy your work.
- Submit assignments in Printed Hard Copies. Email attachments will NOT be accepted. Each assignment will be graded based on timeliness (20%), effort (40%), and correctness (40%).
- Since each session will consist of a web-based practical session, attendance is required and part of the grade.
- Composition of your final grade
- Assignments: weekly assignments, totaling 100 pts
- Mid-term and Final Comprehensive Exams: 3 mid-terms X 50 points each = 150 pts
- Attendance and active classroom participation (50 pts): 1 unexcused absences = 40 pts; 2 absences = 30pts; More than 2 = 0. Points will be deducted for lack of participation in computer-lab exercises.
Weekly Schedule (All Tuesdays)
September 3. Introduction to Genomics (1)
- Lecture Slides:
- Course Overview
- Contents of the human genome (Chapter 1, pg. 3-10)
- Genome organization (Chapter 1, pg. 10-17)
- Assignment 1 (15 pts, due 9/10) [Finalized on 9/5, 7pm]
- (2 pts) (Note: modified from the textbook) Exercise 1.1. (a) Make a very rough estimate of the average density (e.g., number of genes per million base pairs) of protein-coding genes in the human genome, assuming total genome size ~ 3 x 10^6 bp and total number of genes ~ 3 X 10^4 genes.
Answer: 3x10^4 (genes)/3x10^9 (bp; typo in the original question)=1 gene every 10,000 bp
(b) Further assuming that the average gene length is 1000 bp, what is the proportion of bases that code for proteins?Answer: 3x10^4x10,000 (bp in genes)/3x10^9 (bp, total)=1x10^-2, or 1% of the total bases code for genes
- (4 pts) Exercise 1.3. For the standard genetic code (see lecture slides), give an example of a pair of codons related by a synonymous single-site substitution (a) at the third position and (b) at the first position. (c) Give an example of a pair of codons related by a non-synonymous single-site substitution at the third position. (d) Can a change in the second position of a codon ever produce a synonymous mutation?
Answer to (d): No. All 2nd position changes are non-synonymous. Stop codons are not "synonymous" amino acids.
- (4 pts) Exercise 1.4. (a) Is it possible to convert Phe to Tyr by a single base change? If so, what would be possible wild-type and mutant codons?
Answer: Yes. Either TTT (Wild Type, WT) to TAT (Mutant, MU), or TTC (WT) to TAC (MU). Both are changes at the 2nd codon position.
(b) Is it possible to convert Ser to Arg by a single base change? If so, what would be possible wild-type and mutant codons?Answer: Yes. Either AGT (Wild Type, WT) to CGT (Mutant, MU), or AGC (WT) to CGC (MU). Both are changes at the 1st codon position.
(c) What is the minimum number of base substitutions that would convert Cys to Glu?Answer: Three. Cys codons are either TGT or TGC, and Glu codons are either GAA or GAG. These two amino acids don't share the first, second, or the third codon positions.
(d) In the evolution off an essential protein encoded by a single gene, a Trp is converted to a Gln by two successive single-base changes. What is the intermediate codon?Answer: TGG (Trp) through CGG (Arg, 1st position change) to CAG (Gln, 2nd position change). The other possibility is highly unlikely since it goes through a stop codon: TGG through TAG (Stop, 2nd position change) to CAG (Gln, 1st position change)
- (5 pts) Weblem: Use the NCBI Human Genome Resource webpage to identify diseases associated with heamoglobin alpha-1 (HBA1). Summarize its association with the disease "alpha-thalassemia". Include key references and a discussion on why this is a case against "genetic determinism".
Answer: [http://www.omim.org/entry/141800 Online Mendelian Inheritance in Man database Entry 141800] lists 5 diseases associated with HBA1 mutations. See [http://www.omim.org/entry/604131 See OMIM Record #604131] for information on alpha-thalassemia. The key reference is Weatherall (2001), which concludes that heritability of alpha-thalassemia is low and environmental factors influences the disease outcome. Mutations at HBA1 locus alone is not a sufficient predictor of the disease, an argument against "genetic determinism" (At the least, it's not a single-gene genetic disease).
- (2 pts) (Note: modified from the textbook) Exercise 1.1. (a) Make a very rough estimate of the average density (e.g., number of genes per million base pairs) of protein-coding genes in the human genome, assuming total genome size ~ 3 x 10^6 bp and total number of genes ~ 3 X 10^4 genes.
September 10. Introduction to Genomics (2)
- Lecture Slides:
- Assignment 2 (Finalized on 9/11 @11pm)
- (2 pts) (Modified from Exercise 1.8). Using the NCBI human genome browser, find out which of the following bands of human chromosome 16 are gene-rich: p13.3, q22.1, or q11.2?
Answer: According to the NCBI Human Genome Resource page (at the 1/100 zoom level and using "recenter"), the q22.1 has 32 genes, q11.2 has 0 genes, and p13.3 has 74 genes. So q13.3 and q22.1 (both light-colored) are gene-rich, while q11.2 (darker-colored) is gene-poor.
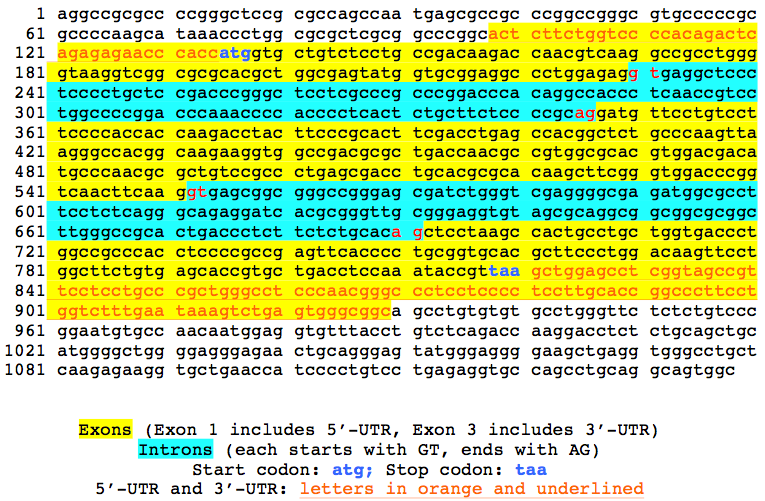
- (4 pts) (Modified from Exercise 1.11). Make a printout of the GenBank file with the Accession "V00488" (print ONLY the part with the DNA sequence). Mark the following sequence regions with highlighters: (a) all introns, (b) all exons, (c) 5'-UTR and 3'-UTR, (d) start and stop codons. (Hint: Use the "Graphics" view with zooming.)
Answer: Using the Graphics view and zoom in at the nucleotide level, you will find the following coordinates: Primary transcript: 98-929, Exon 1: 98-230 (most likely 98-229), Exon 2: 348-551 (should be 347-551), Exon 3: 692-929, Intron 1: 231-347 (should be 230-346, starting with GT and ending in AG), Intron 2: 552-691, 5, Start Codon: 135-137, Stop Codon: 818-820, 5'-UTR: 98-134, 3'-UTR: 821-929
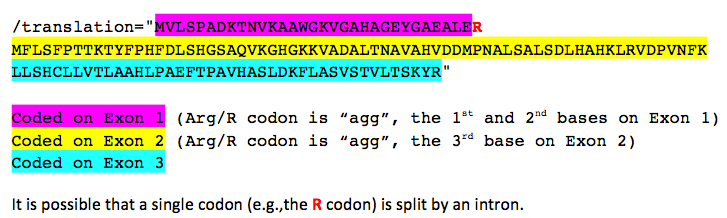
- (4 pts) (Modified from Exercise 1.12). On a separate printout of the GenBank file with the Accession "V00488" (print ONLY the part with the amino-acid sequence). Mark the following regions with highlighters: (a) amino acids coded for by exon 1, (b) by exon 2, (c) by exon 3. (Hint: Use the "Graphics" view with zooming). (D) Is it possible that a single codon is split by an intron (e.g., 1st codon position on exon 1 and 2nd & 3rd nucleotides on exon 2) ?
- (2 pts) (Modified from Exercise 1.8). Using the NCBI human genome browser, find out which of the following bands of human chromosome 16 are gene-rich: p13.3, q22.1, or q11.2?
Answer key for 1.11
Answer key for 1.12

September 17. Introduction to Genomics (3)
- Lecture Slides:
- Genome database (Chapter 1, pg.24-30)
- Cancer genomics: The Cancer Genome Atlas (TCGA) Project
- Genome evolution (Chapter 1. pg.30-35)
- Assignment 3 (Finalized on 9/18, Thursday, 11:55pm)
- (6 pts). Problem 1.6 (on page 38). Instructor's Note: (1) Mark your answers on a printout or copy of Figure 1.17(a); (2) for part (d), show your work. A simple choice without reasoning or explanation will NOT get full credits.
- (4 pts). Read/Watch the following links and extract one example to describe how genome sequencing helps health care.
September 24. First Mid-term Exam
- Review session: 12:45-1:40
- Exam Part I. 1:45-2:30. No computer access
- Exam Part II. 2:30-3:15. Computer-based Practicum (NCBI websites only)
October 1. Genome Structure and Function (1)
- Lecture Slides: (updated)
- Classic Genetics (Chapter 3, pg.80-82)
- Structure of DNA (Chapter 3, pg. 90-93)
- DNA replication and PCR (Chapter 3, pg 93-95)
- Assignment 4 (Finalized as of 10/2, 1pm)
- (5 pts). Two alleles (T and t) are segregating at a single genetic locus In a population of diploid individuals. "T" is the dominant allele and "t" is recessive for a phenotype (e.g., "Taster" and "Non-taster"). If two parents are both heterozygotes at this locus, what is the expected Mendelian ratio of genotypes of their offspring? Mendelian ratio of the phenotypes? Show your work.
Genotypes: TT:Tt:tt=1:2:1; Phenotypes: Taster:Non-taster=3:1
- (5 pts) Answer the following questions about the Polymerase Chain Reaction (PCR):
- Describe the three steps in each round of PCR, including the approximate temperature and the reaction occurring at each step
1. Denature DNA into single strands (95ºC); 2. Anneal primers (50ºC); 3. Synthesize DNA (72ºC)
- What are the key chemical ingredients required for amplifying a DNA region using PCR?
DNA template, primers, DNA polymerase, and nucleotides
- Starting from a single DNA molecule (note: double-stranded), what is the total number of copies of a gene on this DNA after 20 rounds of PCR amplification? Show your work.
2^20=1,048,576
- Describe the three steps in each round of PCR, including the approximate temperature and the reaction occurring at each step
- (5 pts) Fill in Table 1 on Slide #12 based on the gel picture. Explain the basis of your counts and frequencies.
- (5 pts). Two alleles (T and t) are segregating at a single genetic locus In a population of diploid individuals. "T" is the dominant allele and "t" is recessive for a phenotype (e.g., "Taster" and "Non-taster"). If two parents are both heterozygotes at this locus, what is the expected Mendelian ratio of genotypes of their offspring? Mendelian ratio of the phenotypes? Show your work.

October 8. Genome Structure and Function (2)
- Lecture Slides: (updated)
- Test of PTC genotype-phenotype association
- Linkage Map (Chapter 3, pg.82-85)
- Automated Sequencing (Chapter 3, pg 97-104)
- Assignment 5.(Finalized on Friday, 10/11/2013, 12 noon; Updated o nTuesday 10/15/2013)
- (2 pts) Exercise 3.2 (pg.110). Explain.
D=A1B1 x A2B2 - A1B2 x A2B1=0.2x0.45-0.15x0.2= 0.06. D is a measure of linkage disequilibrium (LD) between two loci. When D=0, it means that there is no association between allele frequencies on two loci, or no LD. In this case, D>0, suggesting that chromosome with A1B1 and A2B2 are over-represented (with respect to expectation) in the population.
- (3 pts) Exercise 3.6 (pg.110). Explain.
The bottom band in the middle lane corresponds to the 4 kb BamHI fragment. The 2nd band from the top in the right lane corresponds to the smallest (1.5 kb, with lowest molecular weight) EcoRI fragment. In a gel electrophoresis, DNA molecules travel from the negative electrode towards the positive electrode. This is because DNA is negatively charged in neutral conditions. Smaller DNA fragments, which have lower molecular weights, travel faster than longer ones. Note: 1 kb = 1 kilobases = 1,000 base pairs
- (5 pts) Problem 3.6 (pg.113). Explain. Hints: See figure at right for an illustration of the RNA stem and loop . Compare your results with those produced by this web-based RNA structure predictor: RNAfold web server
(a) DNA synthesis occurs in the direction of 5' to 3', so the shortest synthesized fragment is at the bottom. Therefore, the sequence is: 5'-CCTTATCTCTTGATAGGGAACCGGTTTCCCGGC-3'. (b) There is no long (6 bp or more) hairpin structure predicted for this sequence. The longest exact self-complementary region predicted by the RNAfold program is a 4-bp stem near the 3' end: 5'-CCTTATCTCTTGATAGGGAA{CCGG}TTTC{CCGG}C-3'. (c). Based on the previous analysis, this region of DNA is more likely to encode protein. - (5 pts) Perform a hypothetical genotype-phenotype association study. Individuals are categorized depending on having a disease ("Case") or not ("Control"). Each individual is genotyped at one SNP site with two possible states (e.g., "A" or "G"). The following table is a 2X3 contingency table from the study. Perform a chi-squared test using this website. Answer the following questions:
- What are the expected counts if there is no association between the genotype and the disease phenotype? (Null hypothesis)
See Table 2 below
- What is your chi-square value and the p value? What is your interpretation of the p value? Using a cutoff of p=0.05, what can you conclude from the study (i.e., does it show a statistically significant association between genotype and disease?)
chi-square = 8.97, probability (p value) = 0.011, which is the probability of obtaining observed counts (including more biased counts than these) by chance (i.e., if there is no association between the genotypes and the disease). If p<0.05 is considered statistically significant, the result suggest that the null hypothesis ("no association") could be rejected and there is a statistically significant association between the genotype and the disease. - According to your comparisons between observed and expected counts, which genotype is the most over-represented in individuals with diseases? Which genotype is the most under-represented with diseases?
Compare the observed counts (in Table 1) with corresponding expected counts (Table 2). The "GG" genotype is the most over-represented and the "AA" genotype is the most under-represented in the disease cases.
- What are the expected counts if there is no association between the genotype and the disease phenotype? (Null hypothesis)
- (2 pts) Exercise 3.2 (pg.110). Explain.

| AA | AG | GG | |
|---|---|---|---|
| Case | 221 | 198 | 55 |
| Control | 279 | 212 | 35 |
| AA | AG | GG | |
|---|---|---|---|
| Case | 237 | 194 | 43 |
| Control | 263 | 216 | 47 |
October 15. No Class (Monday Schedule)
October 22. Genome Structure and Function (3)
- Lecture Slides:
- Virtual Lab: Microarray
- Videos for understanding genome functions:
| Transcription | Splicing | Translation |
|---|---|---|
| WsofH466lqk|300|center|Transcription}} | FVuAwBGw_pQ|300|center|Splicing}} | 5bLEDd-PSTQ|300|center|Translation}} |
- Assignment 6 (10 pts). Use the Cancer Transcriptome Website for the following exercises:
- Access the expression data for protein kinase C Beta (PRKCB1).
- Name a group of cancers associated with underexpression of PRKCB1. Attach the figure and show your rationale.
Green color indicates under-expression of a gene in cancer cells (relative to control, healthy cells). Figure 1 (see below) shows that PRKCB1 is under-expressed in, e.g., colon and breast cancer cells.
Notice: Flipped answers to this and the next question are acceptable since the color scheme is not clearly specified on the website. - Name a group of cancers associated with overexpression of PRKCB1. Attach the figure and show your rationale.
Red color indicates over-expression of a gene in cancer cells (relative to control, healthy cells). Figure 1 (see below) shows that PRKCB1 is over-expressed in leukemia cells.
- Name 3 genes with similar cancer expression patterns as PRKCB1. Attach the figure and show your rationale.
Figure 2 (see below) shows that PLCE, CD53, PTPRC, CDW52, LRMP, RHAG, and PDCD genes have similar expression patterns among cancer cells as PRKCB1.


October 29. Genome Structure and Function (4)
- Lecture Slides:
- Cancer Genomics: Field trip to 3rd Annual Symposium of Systems Biology of Cancer at MSKCC. We will attend the Afternoon Session B, which has three talks during 1:30-3pm. Take notes and hand in one copy
- Assignment #7. (Finalized Wed, 10/30, 3pm)
- (2 pts) Exercise 3.14 (pg. 111). Show your work.
see "Contig 2" in the following figure
- (3 pts) Exercise 3.15 (pg. 111). Show your work. [Hint: Enlarge the picture (e.g., double the size), and then measure the lengths of individual fragments and the region with a ruler. Read the measurements in millimeters.]
(a) The minimum coverage of any position is zero (in the gap region, see figure at right), (b) the maximal coverage of any position is at the red vertical line (see figure at right), which is covered by 9 individual reads. (c) The average coverage of the entire region is the sum of lengths of all reads divided by the length of the region. The answer is approximately 4, indicating that on average each DNA position is covered by 4 sequencing reads.
- (5 pts) Search the NCBI Gene database for "BRCA1" gene. Based on this Gene Card for the human version of the gene, summarize its molecular function, chromosomal location, gene structure (number of exons and introns, lengths of primary transcript, mRNA, and protein), mutations associated with cancers. Follow the link to OMIM to find out what are the 185delAG and 5382insC mutations (base substitution, deletion, insertion, consequence to protein synthesis?) and in what exons do they appear. [Hint: See following youtube video for different types of mutations: {{#ev:youtube|kp0esidDr-c|300|center|Frameshift mutations}}

November 5. 2nd Mid-term Exam
- 12:45-1:45. Review
- 1:45 - 2:30. Exam without computer access
- 2:30 - 3:15. Computer-based practicum
November 12. Genome Evolution (1)
- Workshop I. Molecular population genetics and classification (Chapter 2)
- Workshop II. Tree of Life (Chapter 4)
November 19. Genome Evolution (2)
- Workshop III. Evolution of human genome
- Workshop IV. Molecular Evolution: Nucleotide substitutions
November 26. Genome Evolution (3)
- Workshop V. Molecular Evolution: Gene Duplication
- Workshop VI. Molecular Phylogenetics
December 3. Genome Evolution (4)
December 10. Review
December 17. Final Exam
Links
- NCBI Human genome browser: NCBI Human Genome Page
- NIH Encode Project: Discover functions in 1% human genome
- Smithsonian Exhibit: ‘Genome: Unlocking Life’s Code’
- Should human genes be patented? An NYT Op-Ed
- Biological Databases on the Web: 2013 Collection by NAR
- Biological Webservers: 2012 Collection by NAR
- The HapMap Project: Identifying major DNA variations in humans
- The 1000 Genomes Project: Identifying rare DNA variations in humans
- The UCSC Genome Browser: Comparing human and other genomes